Table Of Contents
Last time we built an interactive scatter plot. This time we’re going to turn that scatter plot into a bubble chart (see a preview of the finished product here). Start by openning up the HTML document we created last time. You can see the source here or see the section below:
<!DOCTYPE html>
<html>
  <head>
    <title>Google Chart Example</title>
    <script src="https://www.google.com/jsapi"></script>
    <script src="https://code.jquery.com/jquery-1.10.1.min.js"></script>
    <script src="jquery.csv-0.71.js"></script>
    <script>
      // load the visualization library from Google and set a listener
      google.load("visualization", "1", {packages: ["corechart" ]});
      google.setOnLoadCallback(drawChart);

      function drawChart() {
        // grab the CSV
        $.get("kzn1993.csv", function(csvString) {
          // transform the CSV string into a 2-dimensional array
          var arrayData = $.csv.toArrays(csvString, {onParseValue: $.csv.hooks.castToScalar});

          // use arrayData to load the select elements with the appropriate options
          for (var i = 0; i < arrayData\[0\].length; i++) {
            // this adds the given option to both select elements
            $("select").append("<option value='" + i + "'>" + arrayData[0][i] + "</option");
          }
          // set the default selection
          $("#domain option[value='0']").attr("selected","selected");
          $("#range option[value='1']").attr("selected","selected");

          // this new DataTable object holds all the data
          var data = new google.visualization.arrayToDataTable(arrayData);

          // this view can select a subset of the data at a time
          var view = new google.visualization.DataView(data);
          view.setColumns([0,1]);
          var options = {
            title: "KwaZulu-Natal Household Survey (1993)",
            hAxis: {title: data.getColumnLabel(0), minValue: data.getColumnRange(0).min, maxValue: data.getColumnRange(0).max},
            vAxis: {title: data.getColumnLabel(1), minValue: data.getColumnRange(1).min, maxValue: data.getColumnRange(1).max},
            legend: 'none'
          };
          var chart = new google.visualization.ScatterChart(document.getElementById('chart'));
          chart.draw(view, options);

          // set listener for the update button
          $("select").change(function(){
            // determine selected domain and range
            var domain = +$("#domain option:selected").val();
            var range = +$("#range option:selected").val();
            // update the view
            view.setColumns([domain,range]);
            // update the options
            options.hAxis.title = data.getColumnLabel(domain);
            options.hAxis.minValue = data.getColumnRange(domain).min;
            options.hAxis.maxValue = data.getColumnRange(domain).max;
            options.vAxis.title = data.getColumnLabel(range);
            options.vAxis.minValue = data.getColumnRange(range).min;
            options.vAxis.maxValue = data.getColumnRange(range).max;
            // update the chart
            chart.draw(view, options);
          });
        });
      }
    </script>
  </head>
  <body>
    <div id="chart" style="width:800px; height:500px;"></div>
    <select id="range"></select>
    <select id="domain"></select>
  </body>
</html>
Add Controls for Size and Color
Bubble charts add two dimension, size and color, to the standard scatter plot
(here I’m using Google’s terminology, several other graphics libraries simply add
this functionality to their scatter plot functions). To keep the nice interactivity
we built into our last chart, let’s start by adding controls for the color and size.
We’ll nest everything in an unordered list and add labels to the controls. Just change
the section with two <select> tags to match the following:
<ul>
  <li>Y-Axis <select id="range"></select></li>
  <li>X-Axis <select id="domain"></select></li>
  <li>Color <select id="color"></select></li>
  <li> Size <select id="size"></select></li>
</ul>
Next we want to get rid of the bullets in our unordered list. Add the following
<style> tag inside your <head> tag.
<style> ul {list-style-type: none; } </style>
Changing the Chart Type
Change the line that loads the chart object from this:
var chart = new google.visualization.ScatterChart(document.getElementById('chart'));
to this:
var chart = new google.visualization.BubbleChart(document.getElementById('chart'));
Feeding the Data to the Chart
The data table for Google’s bubble chart requires the first coloumn to be a string
which can be used to identify the bubbles. When we loaded the CSV into an array in
the last tutorial,
we parsed all values as scalars. We need to update our DataView call to change the
values in the first column, the household ids (hhid), to string. This requires us to
add a function to retrieve these strings from the DataTable.
var view = new google.visualization.DataView(data);
view.setColumns([{calc:stringID, type: "string"},1,2,3]);
// this function returns the first column values as strings (by row)
function stringID(dataTable, rowNum){
  return dataTable.getValue(rowNum, 0).toString();
}
Updating the Chart
Now we need to modify the code that updates the chart when a user changes the selected
variables. First we’ll add local variables for color and size to the <select> listener
function. These variables need to be assigned the value of the respective <select> tag.
After we have column indices for color and size, we will set these as the third and fourth
columns (after the id column) in our bubble chart view. See the highlighted lines below:
$("select").change(function(){
  // determine selected domain and range
  var domain = +$("#domain option:selected").val();
  var range = +$("#range option:selected").val();
  var color = +$("#color option:selected").val();
  var size = +$("#size option:selected").val();
  // update the view
  view.setColumns([{calc:stringID, type: "string"},domain,range,color,size]);
  // update the options
  options.hAxis.title = data.getColumnLabel(domain);
  options.hAxis.minValue = data.getColumnRange(domain).min;
  options.hAxis.maxValue = data.getColumnRange(domain).max;
  options.vAxis.title = data.getColumnLabel(range);
  options.vAxis.minValue = data.getColumnRange(range).min;
  options.vAxis.maxValue = data.getColumnRange(range).max;
  // update the chart
  chart.draw(view, options);
});
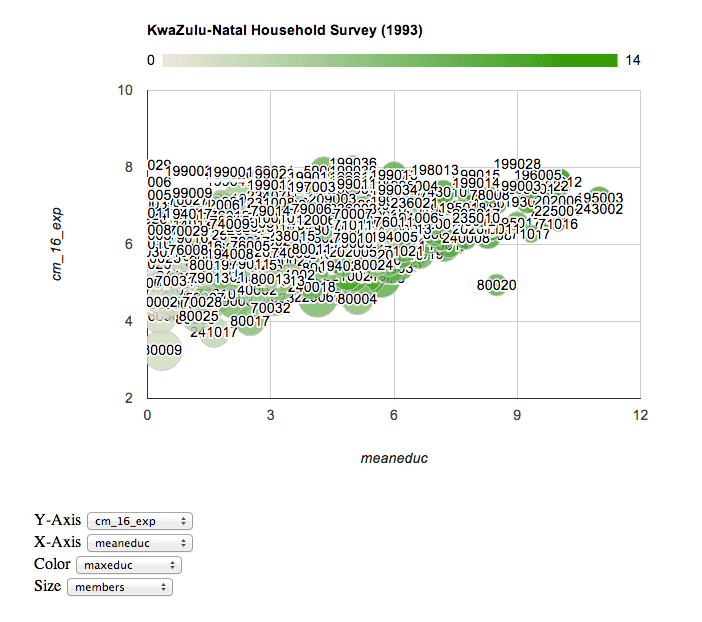
Unfortunately, when I test this and select a few variables of interest I get the following chart. This is not very useful. The id values obscure all the information.

Improving Upon the Defaults
Removing the Bubble Label
The bubble labels would work fine if we had only a few data points and being able to
quickly identify them was important. In this case, we are more interested in the general
relationships between the variables and not the specific position of any one household.
Let’s start by removing the bubble label. Go to our stringID function and return an empty
string instead of the household id (be sure to comment out the old return statement):
function stringID(dataTable, rowNum){
  // return dataTable.getValue(rowNum, 0).toString();
  // return an empty string instead to avoid the bubble labels
  return "";
}
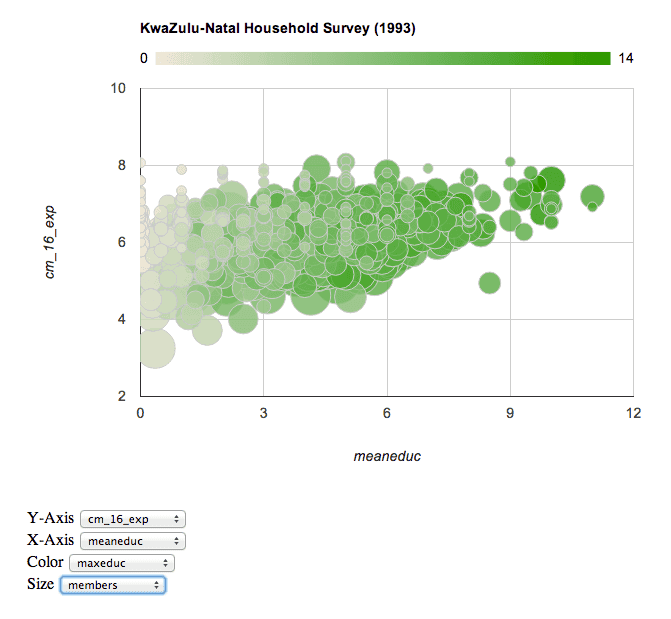
Now let’s check our chart:

Removing the Bubble Border and Adjusting Bubble Opacity
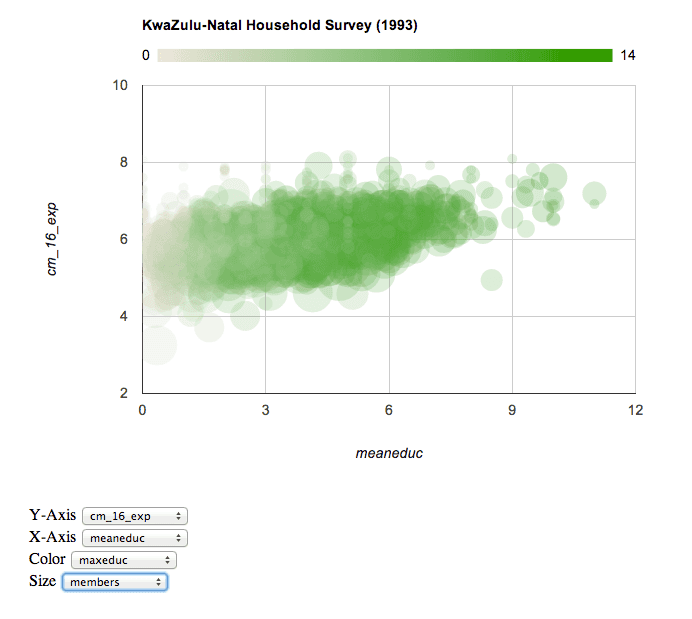
Okay. This is a lot nicer, but we can do better by removing the bubble borders and
lowering the bubble opacity, since both cause issues with occlusion (i.e., there is
data we are not seeing due to overly opaque data in the foreground). To remove the
bubble’s border we’ll set it’s stroke color to “transparent”. Let’s change the opacity
from the default of 0.8 to 0.2. To implement this we need to add an element to our
initial options object
var options = {
  title: "KwaZulu-Natal Household Survey (1993)",
  hAxis: {title: data.getColumnLabel(0), minValue: data.getColumnRange(0).min, maxValue: data.getColumnRange(0).max},
  vAxis: {title: data.getColumnLabel(1), minValue: data.getColumnRange(1).min, maxValue: data.getColumnRange(1).max},
  bubble: {stroke: "transparent", opacity: 0.2},
};
and reset it in our <select> listener function:
// update the options
options.hAxis.title = data.getColumnLabel(domain);
options.hAxis.minValue = data.getColumnRange(domain).min;
options.hAxis.maxValue = data.getColumnRange(domain).max;
options.vAxis.title = data.getColumnLabel(range);
options.vAxis.minValue = data.getColumnRange(range).min;
options.vAxis.maxValue = data.getColumnRange(range).max;
options.bubble = {stroke: "transparent", opacity: 0.2};
Let’s take a look:

Changing the Color Gradient
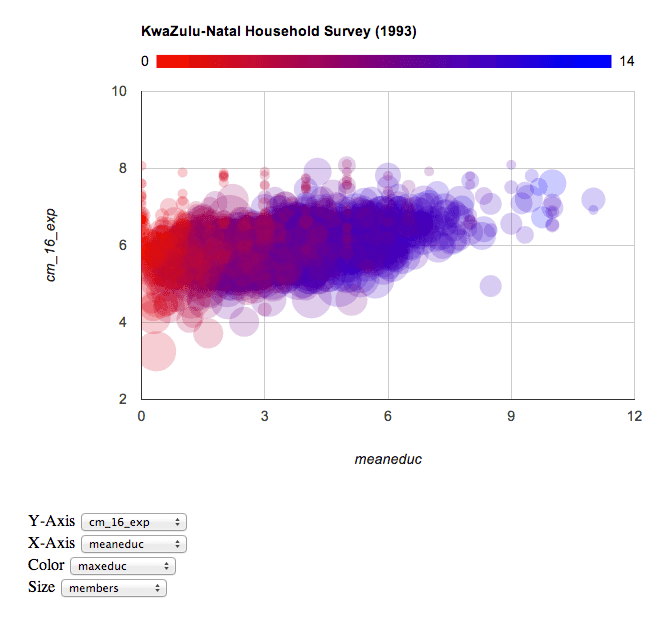
This is starting to look great. One issue I have with the default color choice, besides
being ugly, is that gray with an opacity of 0.2 is hard to see. Let’s make the color
gradient change from red to blue. We do this again by adding an element to the initial
options object
var options = {
  title: "KwaZulu-Natal Household Survey (1993)",
  hAxis: {title: data.getColumnLabel(0), minValue: data.getColumnRange(0).min, maxValue: data.getColumnRange(0).max},
  vAxis: {title: data.getColumnLabel(1), minValue: data.getColumnRange(1).min, maxValue: data.getColumnRange(1).max},
  bubble: {stroke: "transparent", opacity: 0.2},
  colorAxis: {colors: ['red','blue' ]},
};
and resetting it in our <select> listener function:
// update the options
options.hAxis.title = data.getColumnLabel(domain);
options.hAxis.minValue = data.getColumnRange(domain).min;
options.hAxis.maxValue = data.getColumnRange(domain).max;
options.vAxis.title = data.getColumnLabel(range);
options.vAxis.minValue = data.getColumnRange(range).min;
options.vAxis.maxValue = data.getColumnRange(range).max;
options.bubble = {stroke: "transparent", opacity: 0.2};
options.colorAxis = {colors:\['red','blue'\]};
Bam! And here’s our finished product:

Conclusion
While this ramped up the complexity of our figure (compared to the chart from the previous tutorial), being able to change which variables control the color and size of the bubbles will make your data that much more engaging. Take the source, change the reference to your CSV, and remember to download a copy of the jquery-csv script. With just a few steps you can have your own interactive chart to encourage your site’s viewers to explore your data. Check out the next tutorial in this series: Google Charts and CSV Part 3: Side-by-Side Bubble Charts For more information on Google’s bubble chart, check the documentation here.
Related Posts
Quick Links
Legal Stuff
Social Media
